Student assessment trends: A brief history and a bright future
A psychometric expert looks back on 50 years of testing innovation and highlights emerging technologies and methodologies to show educators what their students have learned
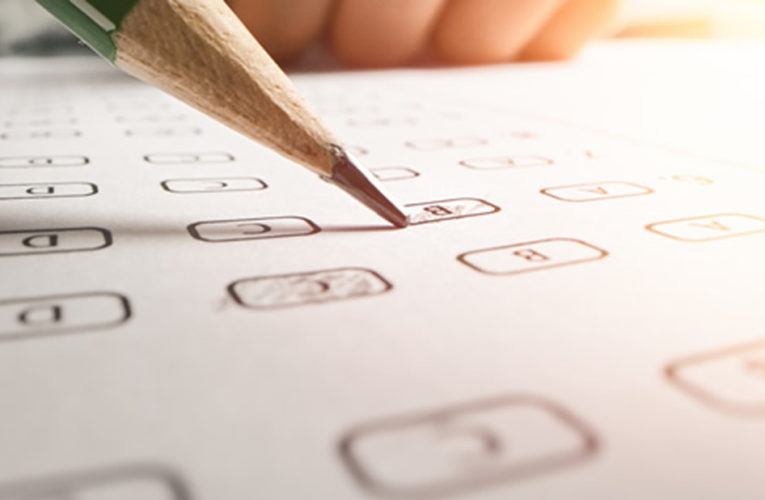
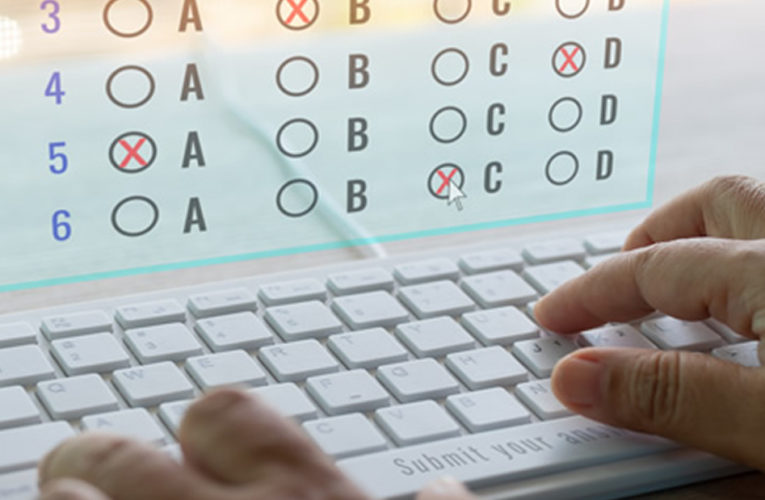
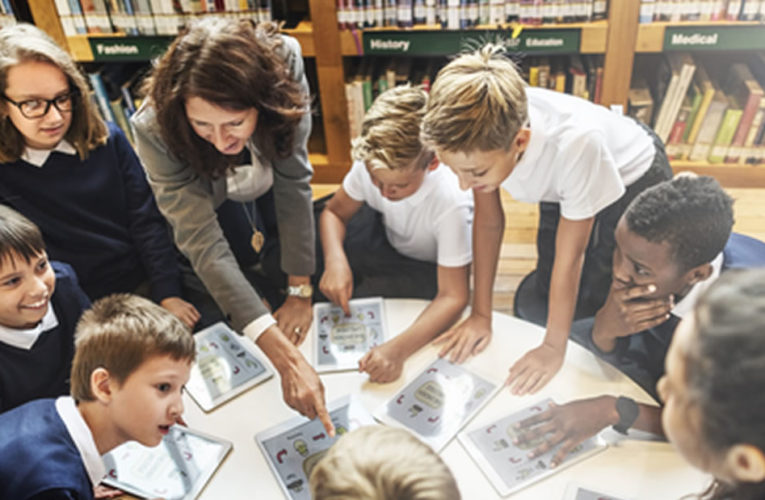
Assessment is a valuable complement to instruction. It tells us who has learned and who hasn’t so educators can determine what’s most likely to help a student grow and succeed in the future. With nearly half a century invested in psychometric research—the study of educational and psychological measurement—I think it’s … Read More